Observability
Unified Dashboards for Metrics That Matter
This isn’t just a graphing tool—it’s your infrastructure’s live status board, your latency early warning system, your release impact detector and your historical insight engine.
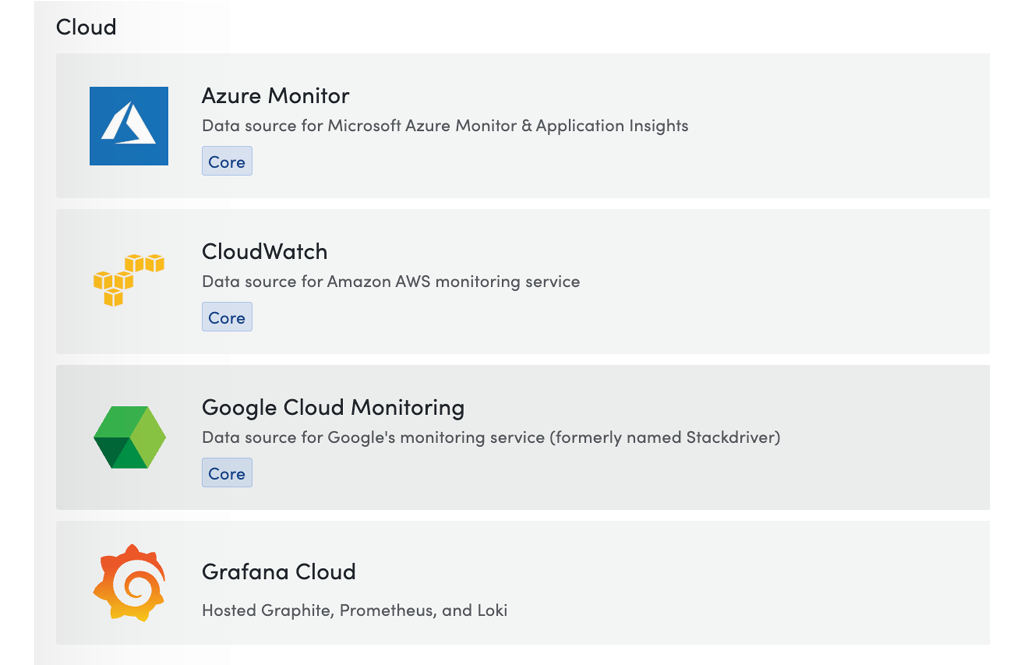
Bring Your Own Data
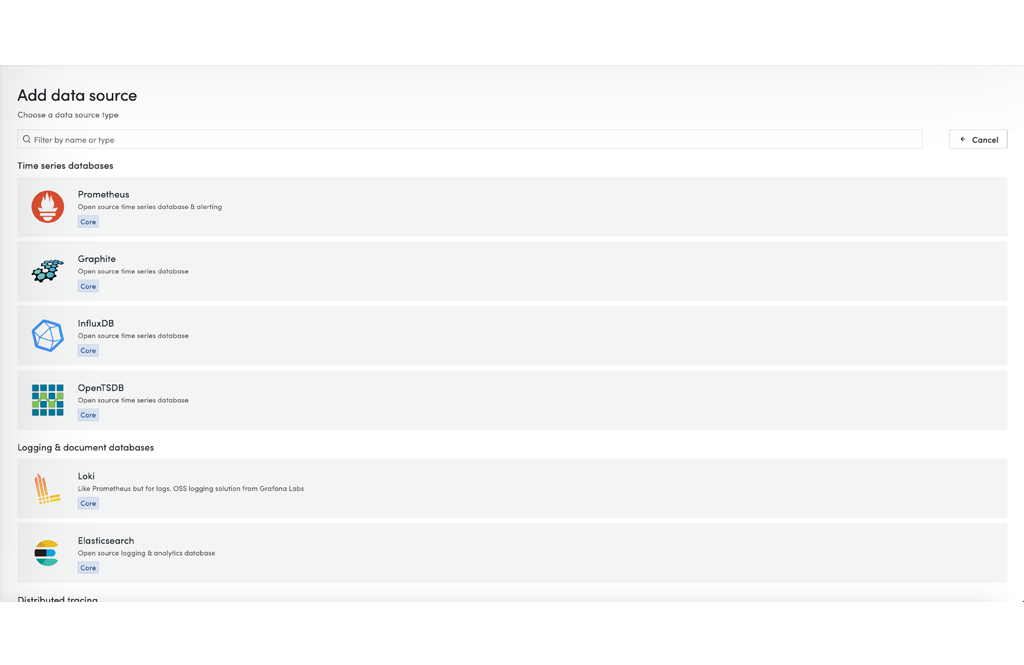
Observability connects seamlessly to a wide range of time series and trace/log data sources, including:
-
Prometheus
-
OpenTSDB
-
Jaeger (tracing)
-
Loki (logs)
-
CloudWatch
-
MySQL / Postgres (via time-based queries)
-
Elasticsearch, InfluxDB, Graphite and more (extensible connector model)
You’re not locked into a single telemetry stack. Mix and match sources across environments, tenants and teams—Fyrii handles the rest.

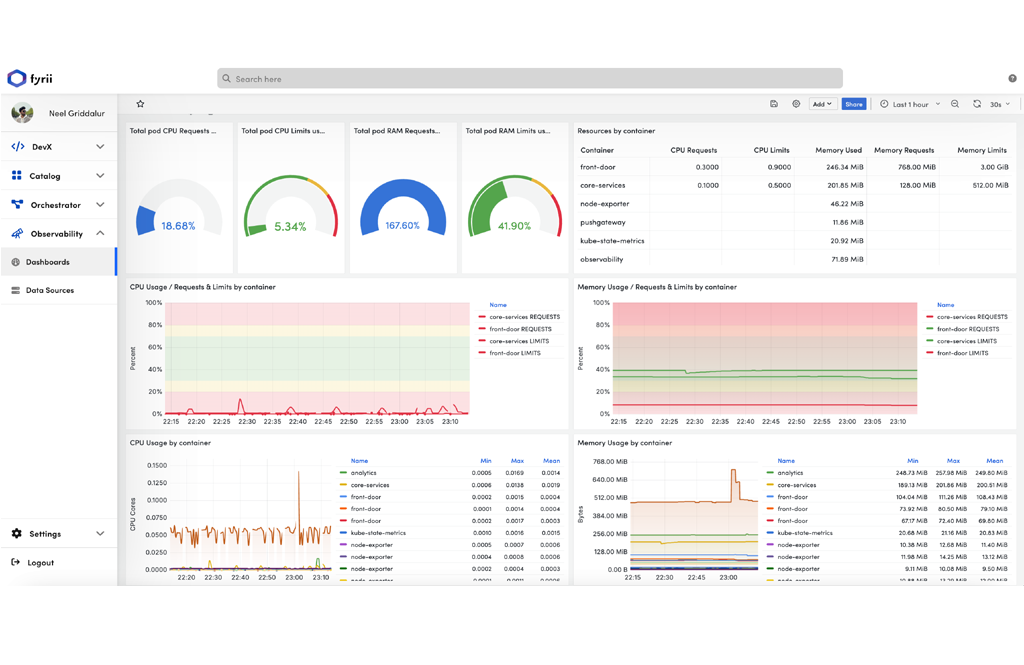
Flexible Dashboard Builder
Using the visual editor, you can create and customize dashboards with a wide array of widgets, including:
-
Line graphs with dynamic time ranges
-
Bar charts for grouped metrics (e.g., CPU by pod)
-
Speedometer-style widgets for health and thresholds
-
Value cards (e.g., error rate, DB connections)
-
Heatmaps, tables and logs overlays
Widgets support templating, variable interpolation (e.g., {{pod_name}}, {{region}}) and data transformation (rate, avg, sum, percentiles, etc.).
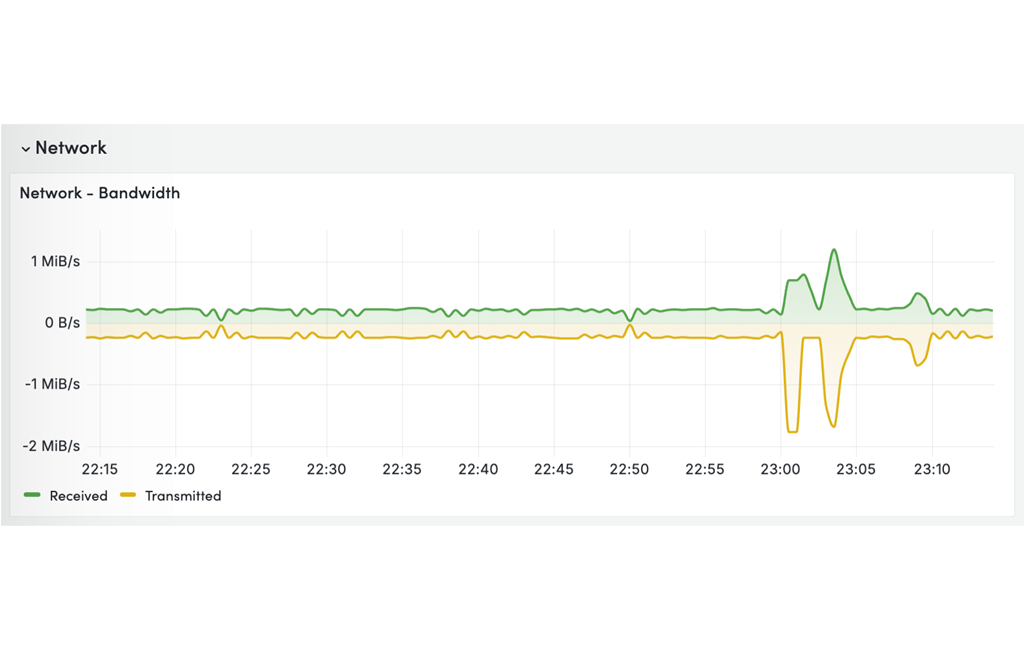
Use Cases That Actually Matter
-
Track system health: CPU, memory, disk I/O, network traffic
-
Monitor Kubernetes workloads: per-node, per-pod, per-namespace
-
Analyze API latencies and request rates
-
View tracing data over time (with Jaeger integration)
-
Correlate logs + metrics in a single dashboard
-
Set up release regression views (e.g., 95th percentile latency before/after deploy)
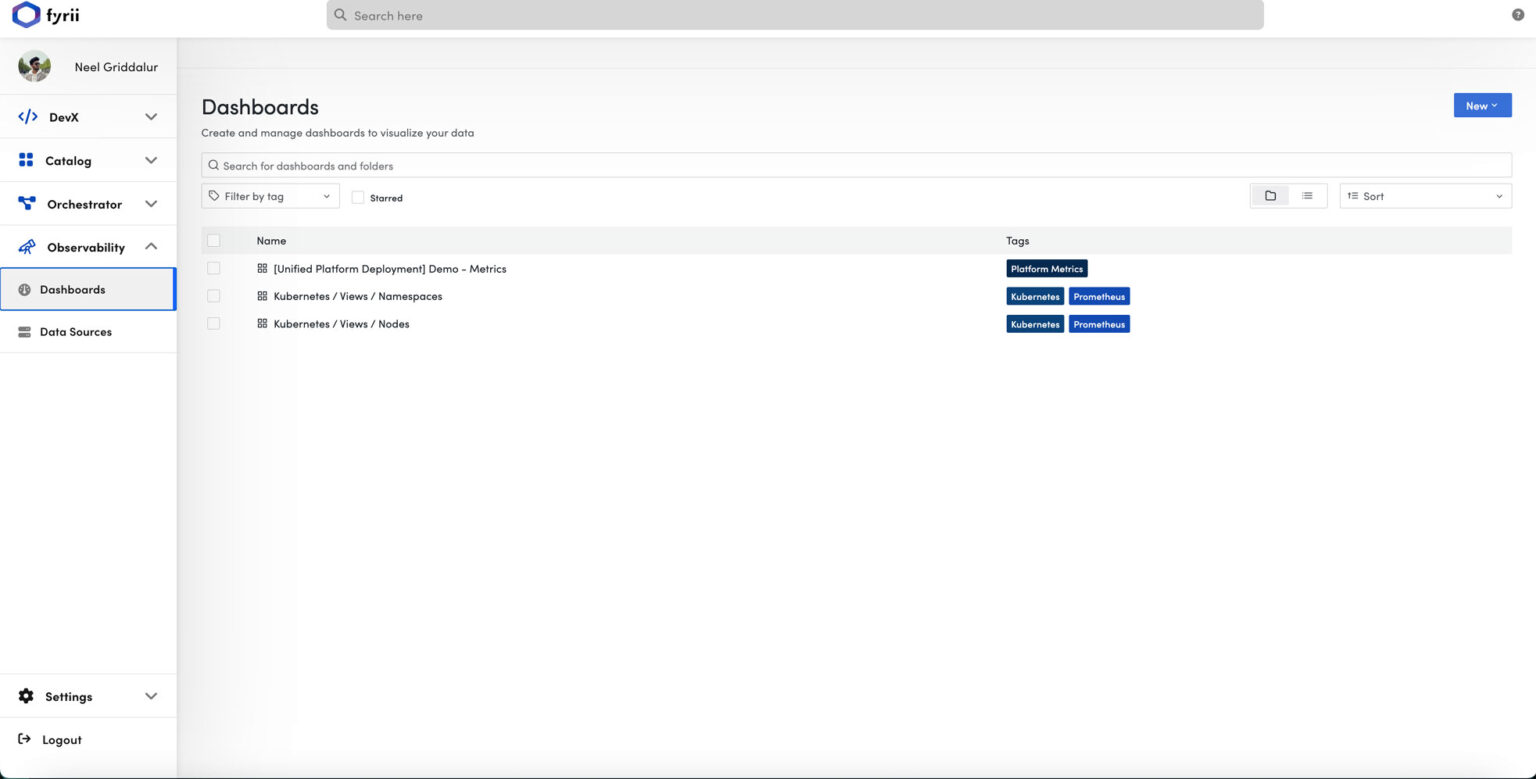
Built for Teams and Scaling
-
Dashboards can be shared, cloned or templated per environment or team
-
Supports role-based access control—control who sees what
-
Works across multi-tenant setups without duplication
-
Supports time travel with historical comparisons, overlays and event annotations
Why Use Observability?
-
One Tool, Many Sources – Avoid tool sprawl. Bring logs, metrics, traces and relational data together in one UI.
-
Infra + App Visibility – Get full-stack insights—from CPU to SQL to frontend latency.
-
Faster Troubleshooting – Correlate spikes and slowdowns across data types, instantly.
-
Custom Dashboards, No YAML Hell – Build what you need visually, share it broadly.
-
Pluggable by Design – Add your data source, start graphing—no vendor lock-in.